Introduction To Speedcubing As A Dataset For Statistical Analysis
 Speedcubing, the practice of solving twisty puzzles such as the 3×3×3 Rubik's Cube as quickly as possible, offers an unusually rich dataset for capstone-level statistical research 🔬. Each solve produces a measurable completion time, and repeated sessions generate observations that can be compared across days, methods, and conditions. Because the data are numerical, sequential, and influenced by both skill and inconsistency, speedcubing is well suited to descriptive and inferential analysis.
From an academic perspective, speedcubing times are useful because they combine human learning patterns with measurable variation. A solver may improve over time, yet still show occasional slow solves caused by pauses, recognition errors, or mechanical issues. This creates a dataset in which central tendency and dispersion matter equally. As a result, capstone researchers can use speedcubing to examine performance trends, variability, and the relationship between practice structure and outcome quality in a concrete, testable way.
Methodology Of Collecting And Organizing Solve Times
A sound methodology begins with careful data collection. Solve times should be recorded under consistent conditions, including the same puzzle type, similar scrambling standards, and a stable solving environment. Researchers often collect at least 100 to 300 solves so that short-term randomness does not dominate the dataset. Each record may include:
- the raw time,
- session date,
- scramble identifier,
- penalty status,
- and notes on solving conditions.
At the data organization stage, the researcher must decide how to structure the sample for analysis. Times can be grouped by session, week, or training phase depending on the research question. For students developing the written structure of such a study, a capstone project writing service can also serve as a reference point for how methodology and findings are formally arranged. In spreadsheet or statistical software, solve times should be cleaned by removing invalid entries, labeling outliers, and separating official averages from single-solve results before any interpretation begins.
Statistical Methods Used For Analyzing Performance Trends
The first stage of analysis usually relies on descriptive statistics.
Mean (average) solve time provides an overall performance estimate, while median (middle value) solve time often offers a better picture when a few unusually slow solves distort the average. Standard deviation is essential because it measures consistency; a solver with a moderate mean but low dispersion may be more stable than a solver with a faster average but wider fluctuations. Range and interquartile spread also help identify how concentrated or scattered the results are.
Beyond description, trend analysis can be applied to examine improvement over time. A line graph of sequential solves may reveal gradual decline📉 in average time, while moving averages can smooth random noise and make underlying progress more visible. Correlation analysis may be used to test whether solve order, session length, or practice frequency is associated with improvement. In more advanced capstone work, regression models can estimate the rate of change in performance and distinguish sustained progress from temporary variation.
Descriptive And Inferential Measures
Inferential methods add depth when the project compares groups or phases. For example, a researcher may test whether morning sessions differ significantly from evening sessions, or whether times after a change in solving method are statistically lower than before. In such cases, t-tests or nonparametric alternatives can evaluate whether observed differences are likely meaningful rather than random.
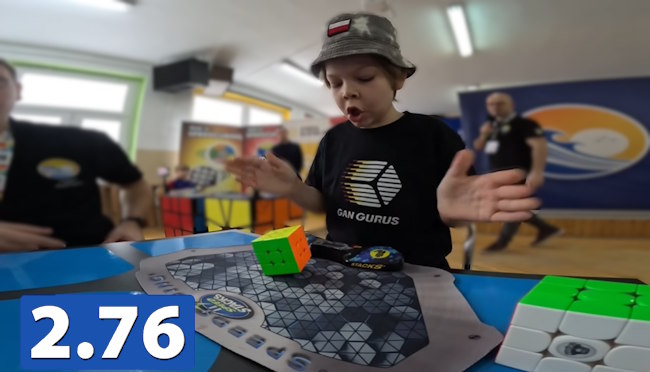
Ten-year-old Polish speedcuber Teodor Zajder setting the first Rubik's Cube record under 3 seconds.
The choice of test depends on sample size, distribution shape, and study design. Because speedcubing data may contain skewed values or performance spikes, researchers should first assess normality and identify whether assumptions for parametric testing are met. This step strengthens the validity of the capstone and prevents overconfident claims based on unstable evidence.
Interpretation Of Results And Performance Variability
Interpreting speedcubing results requires more than identifying the fastest average. A lower mean solve time may suggest improvement, but it does not automatically indicate reliable performance. If standard deviation remains high, the solver may still be inconsistent despite becoming faster overall. In capstone research, this distinction matters because performance quality often depends on both speed and stability. A solver who consistently produces mid-level times may demonstrate stronger control than one who alternates between excellent and poor results.
The table below illustrates how grouped solve data can support interpretation.
|
Solve group |
Mean time (seconds) |
Median time (seconds) |
Standard deviation |
|
Early sessions |
24.8 |
24.5 |
3.9 |
|
Middle sessions |
22.6 |
22.3 |
3.1 |
|
Late sessions |
20.9 |
20.7 |
2.4 |
This pattern suggests not only faster solving over time but also reduced variability. Such findings may indicate improved recognition efficiency, better turning control, or stronger familiarity with solution algorithms. However, interpretation should remain cautious. External factors such as fatigue, puzzle condition, or inconsistent practice schedules may also affect dispersion and should be acknowledged as possible limitations.
Practical Applications For Capstone Research
Speedcubing-based research has practical value because it connects statistical theory to an accessible performance task. A capstone project on solve times can demonstrate how descriptive statistics, trend modeling, and variability analysis work in a real behavioral dataset. It also allows students to discuss broader issues such as learning curves, motor skill development, and the balance between average performance and consistency. This makes the topic especially useful for students in mathematics, psychology, sports science, data analytics, or education.
From a research design standpoint, the project can be expanded in several directions. One study might compare beginner and advanced solvers, while another could examine whether deliberate practice reduces variance more effectively than casual repetition. A third approach could test how different averaging systems shape conclusions about performance quality. In each case, speedcubing times provide enough structure for statistical rigor and enough variability for meaningful interpretation. For capstone work, that combination makes the dataset both manageable and analytically valuable.